
Proactive health checks for VMware customers.
VMware's Technical Account Managers check the health of their customers' infrastructure and recommend improvements. That work was manual, slow and inconsistent. I designed the experience in Skyline that turned it into a guided, largely automated report, from activating the service to sharing the final PDF.

- Role
- Product Designer: user journeys, wireframes and final UI
- Team
- 3 product designers, working with product, front-end and QA
- Timeline
- 5 months
- Product
- VMware Skyline Advisor and Skyline Viewer
To comply with my non-disclosure agreement, I have omitted and obfuscated confidential information. This case study is my own and doesn't necessarily reflect the views of VMware or Broadcom.
What a health check is.
Skyline gathers infrastructure findings that a Technical Account Manager (TAM) can use in a customer health check. Before this project, turning those findings into a report relied on manual work and several handoffs.
Three people, one report.
Anita activates the service as an administrator. Anil, the TAM, prepares the health check. Paul in Professional Services can create a report when a customer requests one.
Anita, VI admin
Manages her company's VMware environment. She activates the TAM service in Skyline Advisor and receives the reports. Access depends on her company's support entitlement.
Anil, Technical Account Manager
Delivers health checks to his customers at least once a year, and more often if needed during the engagement. Mostly works from automated findings, adding manual ones in special cases.
Paul, Professional Services
Delivers one-off health checks that customers buy on demand, for a selected part of their inventory. Uses both automated and manual findings.
Mapping the handoffs first.
Activation starts in Skyline Advisor and finishes in Skyline Viewer. I mapped what each person could see and do before designing the screens.

From activation to a finished report.
Two clear steps for the customer
The customer sees two steps and can copy the organisation ID for the TAM.

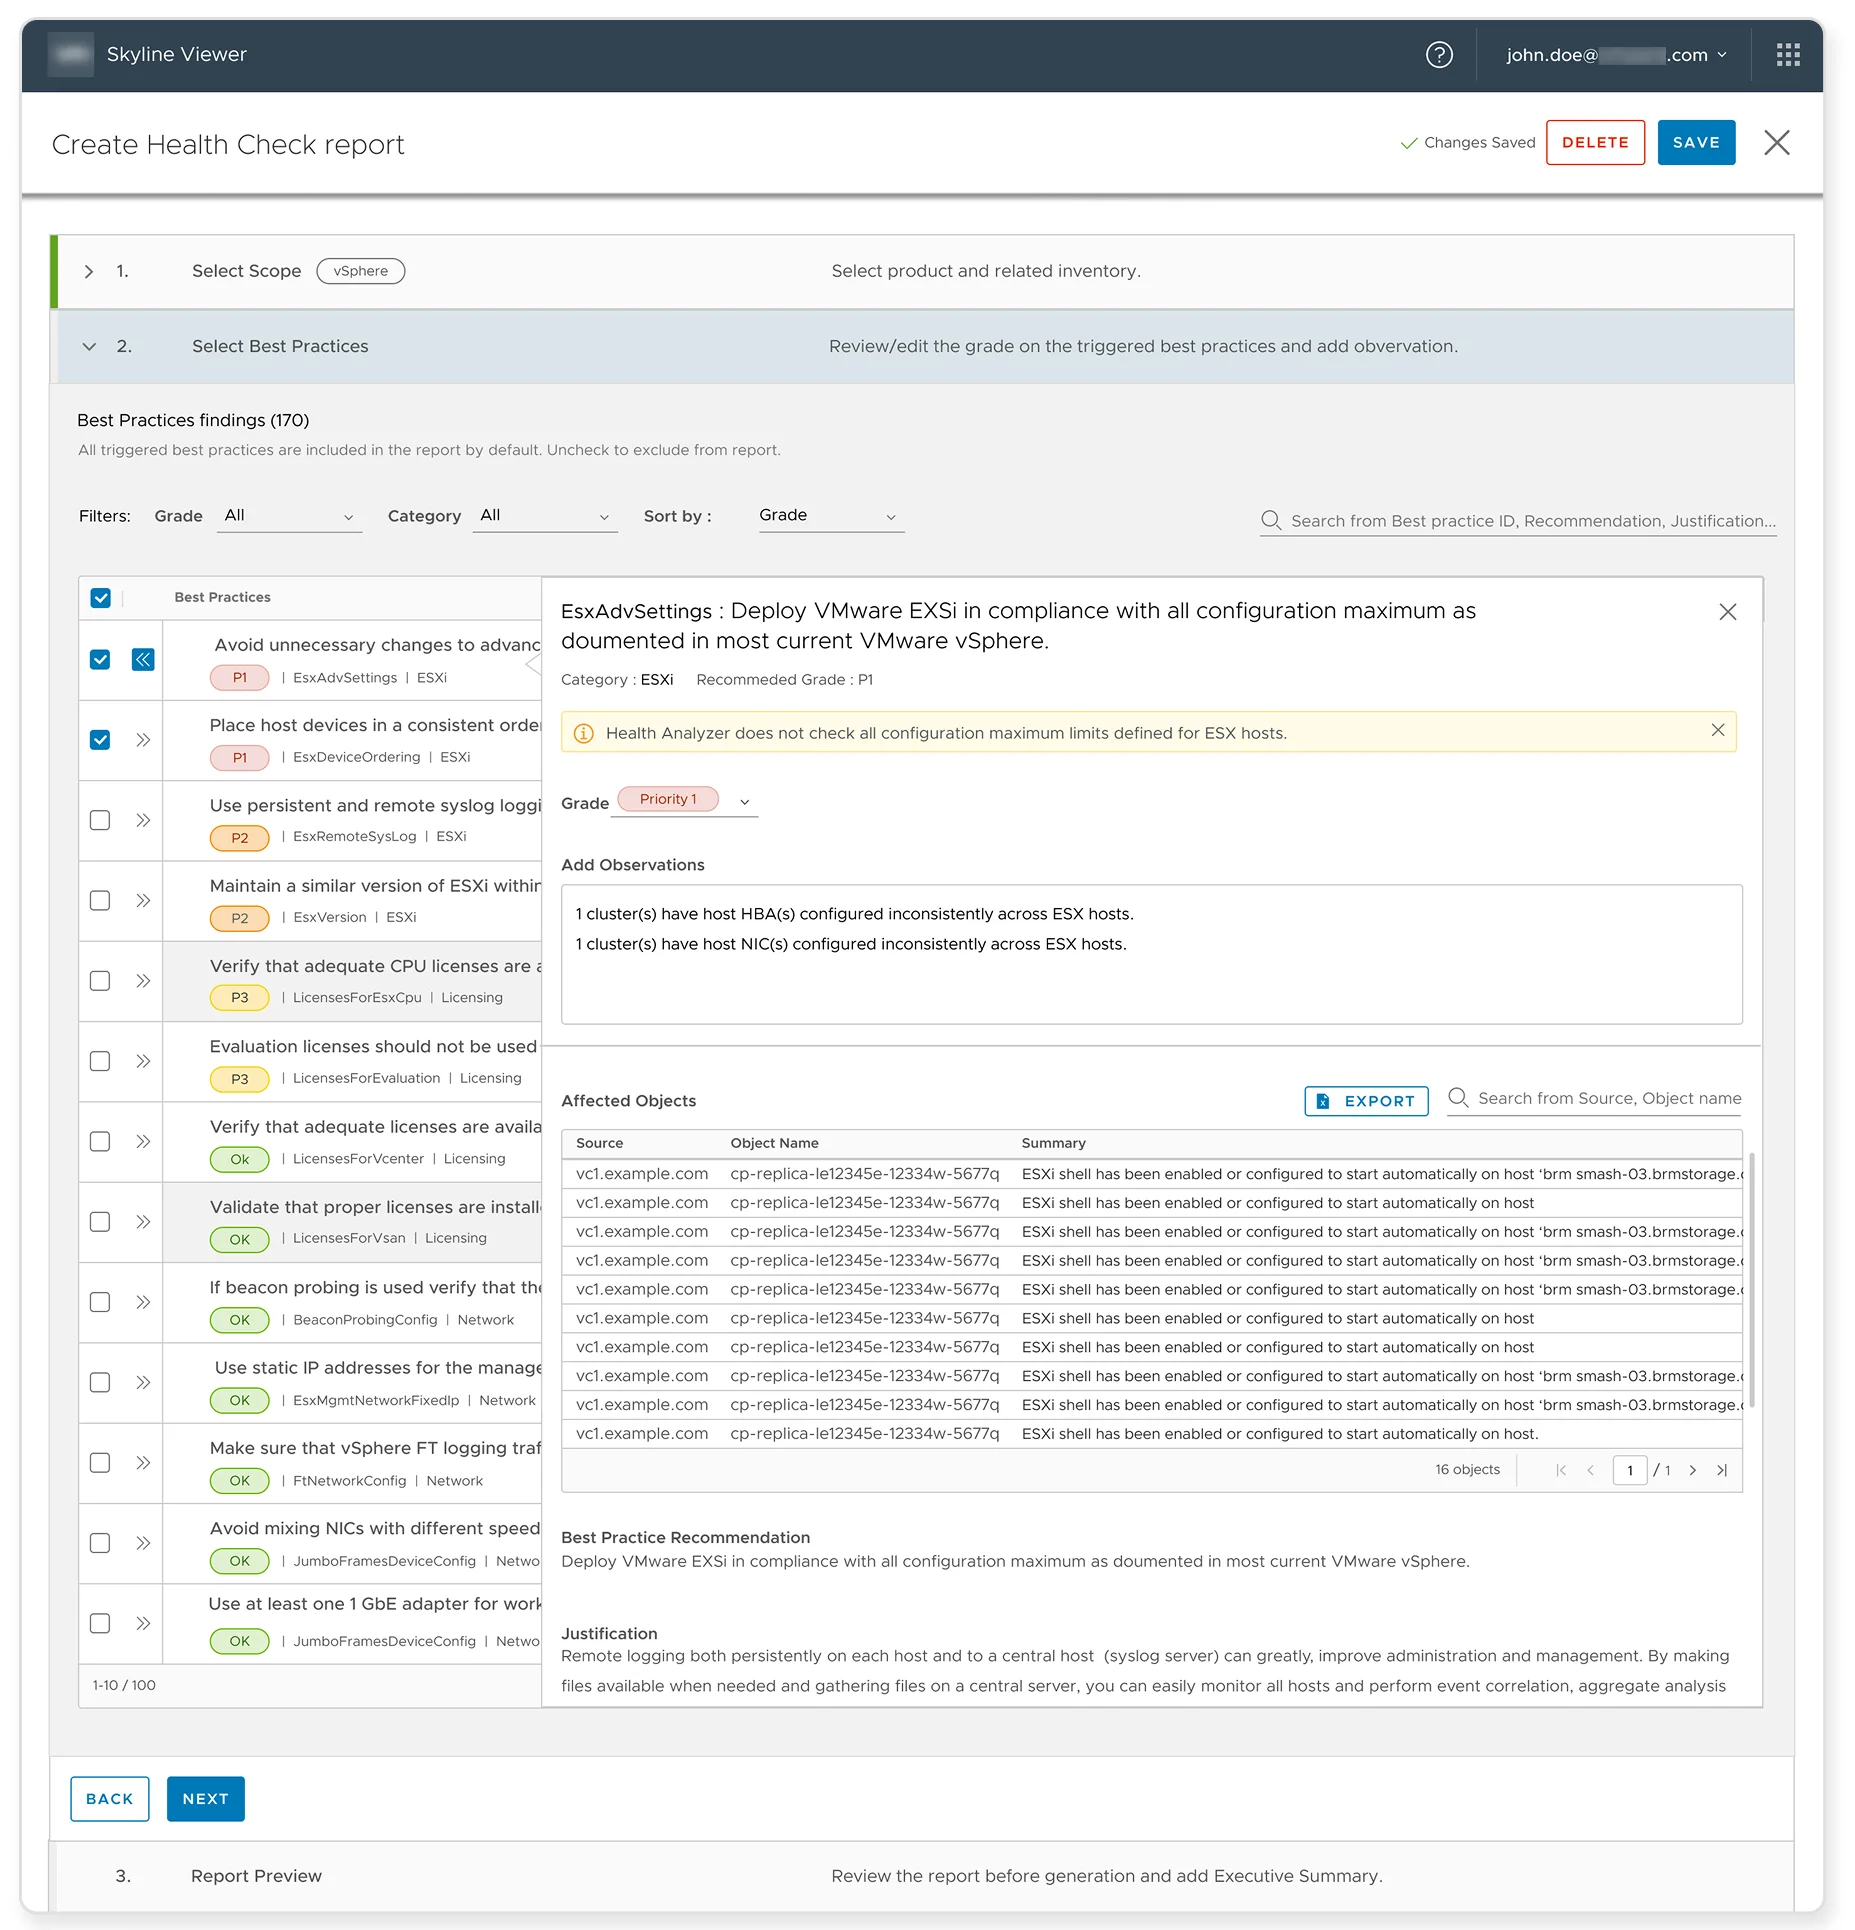
Start from what Skyline already found
Triggered best-practice findings are included by default. The TAM reviews grades and adds observations before previewing the report.
Readable by the customer, not just the expert
The report brings an executive summary, severity heatmap and detailed findings into one exportable view.

Every report in one place
The library keeps completed reports and data exports together for the entitled roles.

Seeing it through to release.
I worked with product, frontend and QA through handoff and user acceptance testing. Access across the three roles produced the most edge cases.
What this project taught me.
Mapping the handoffs early made the report flow easier to design and test across roles.